II
Component Two

Econometric
Sector Models

Establish a means for effective allocation, within the broader bias, to each broad market sub-sector. The same discipline, sector by sector. Then the arithmetic that turns 34 separate models into one allocation.

11  global sectors 5  macro factors 120  monthly observations each

Eleven sectors, modelled the same way

Nothing new is introduced here. The point is that nothing new is introduced here.

Each of the 11 global sectors is modelled against the same five macro factors used for the markets. Same window, same estimation, same definition of mispricing. A sector is simply another index with an economy underneath it.

Modelling sectors globally rather than country by country is deliberate. A global health care company is exposed to global health care conditions, not to the economy of the exchange it happens to be listed on.

Earlier versions of this framework had to weight Real Estate to benchmark and calculate the remaining sectors ex Real Estate, because the benchmark of the day carried no Real Estate sector index. That workaround is gone. All 11 sectors are modelled on the same footing.

A signal is not a weight.

The step that stops a well fitting model and a coin toss being treated alike.

Two markets can be twenty per cent above their model value and mean entirely different things. In one, the model explains ninety per cent of a decade of price movement, and twenty per cent is a finding. In the other it explains thirty per cent, and twenty per cent is noise wearing a suit.

So every raw mispricing is cut back by how much of the index its model actually explains. Take the share of price movement the model does not explain, halve it because we are concerned with one tail rather than both, and reduce the signal by that much.

Prominence goes to markets and sectors that are badly mispriced and well explained. The lowest readings are where actual and model levels are close together and the model was weak anyway, which is to say where there is nothing to act on and no confidence to act on it with.

From signal to allocation

1
The adjusted signal becomes a scalar

An overvalued index scales to less than one, an undervalued index to more than one. The scalar is floored at zero: no model is permitted to produce a negative weight.

2
The scalar is applied to the benchmark weight

It multiplies the benchmark weight rather than replacing it. This is the part that keeps the framework honest. A market that is 72% of the benchmark and modestly expensive becomes a slightly smaller 72%, not an act of conviction.

3
The results are normalised back to 100%

What comes out is a complete set of weights that sums to the whole, expressed in the same units as the benchmark, and therefore directly comparable to it.

4
Countries and sectors meet in one grid

23 country models and 11 sector models meet in one grid. The markets group into 8 regions, so the matrix is 8 by 11: 88 cells, each holding a benchmark weight and a Mercia weight. The difference between them is the position.

A sector model, live

Live output · Sep 2026

Health Care

The global Health Care index against its Mercia model value. Oct 2016 to Sep 2026, 120 monthly observations.

Index level
621
Model value
612
Potential
-1.5%
Fit
95.9%
Benchmark weight
9.0%
Mercia weight
11.0%
621 612 201620182020202220242026
Index level Mercia model value Above model Below model

From a signal to a weight. The gap on its own is not an instruction. It is first cut back for how much of the index the model actually explains, and the result is then applied to the benchmark weight rather than replacing it. That is how a -1.5% reading becomes a 11.0% weight against a 9.0% benchmark weight, and not a bet several times that size.

The full Health Care model

Sectors as a check on markets

Two instruments pointing the same way is worth more than either pointing alone.

Taken together the 11 sector models also serve as a check on the market models. If a market model calls a market heavily overpriced, and the sectors that make up that market are predominantly overpriced too, the general stance is confirmed from a second direction.

When they disagree, that is more interesting still, and it is usually the more useful reading: the mispricing is concentrated somewhere specific rather than spread across the whole market. The sector models are how you find out where.
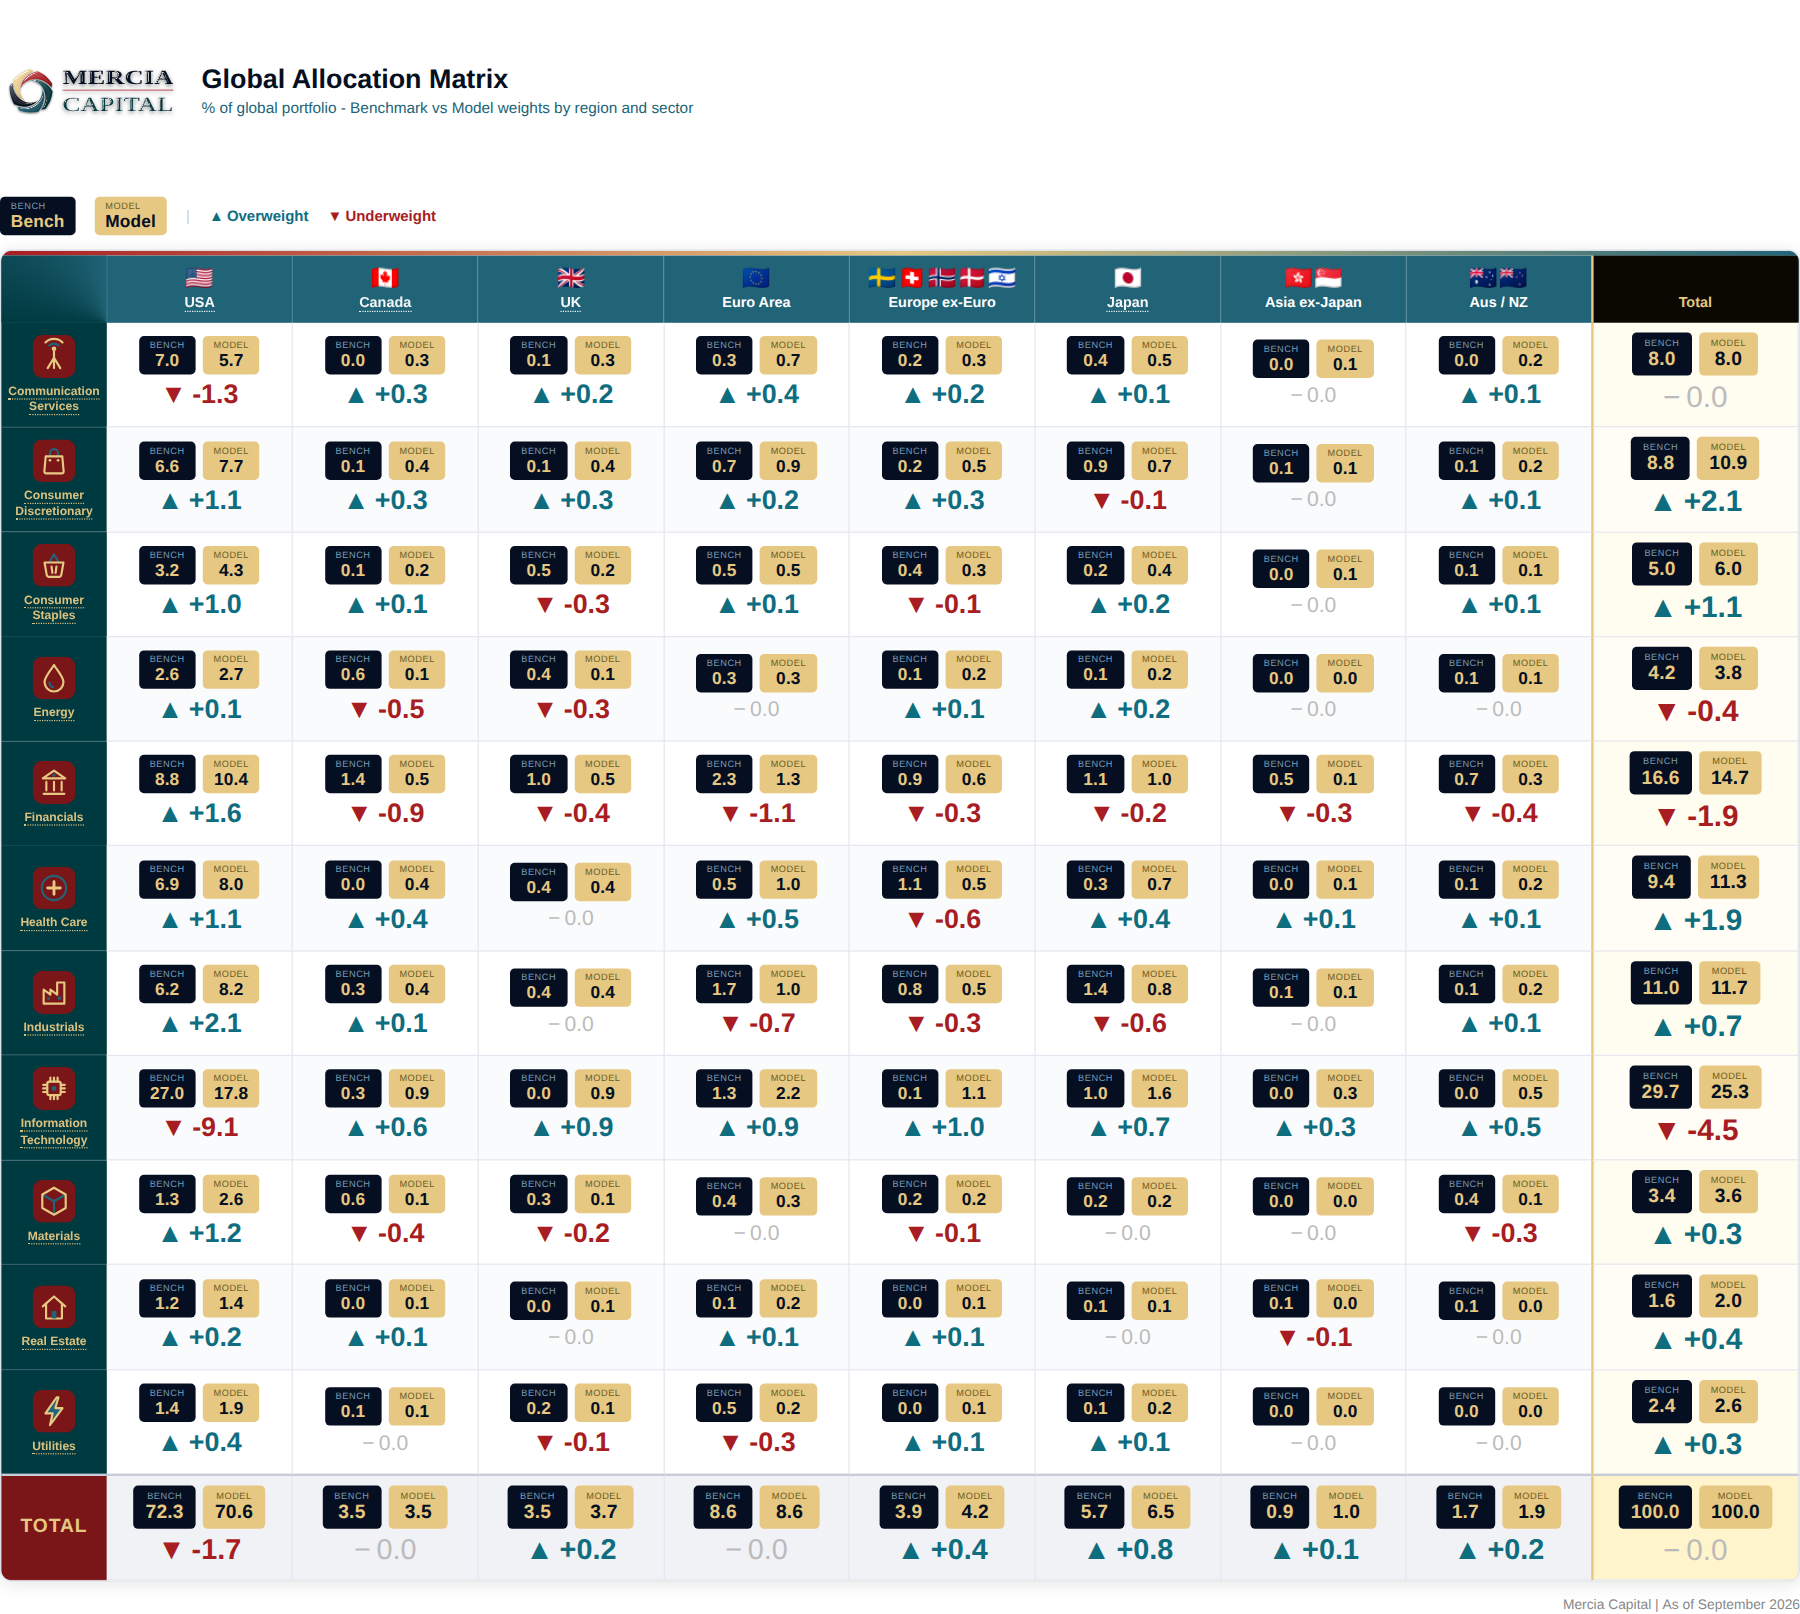
The Mercia global allocation matrix: eight regions against eleven sectors, each cell carrying the benchmark weight, the Mercia model weight and the difference between them.
The allocation matrix as published, eight regions against eleven sectors. Benchmark weight, model weight and the difference, in every cell. As at September 2026.

Overweight and underweight here mean only that the models produce weights differing from the benchmark. They are a framework to measure decisions against, and the clearest way we know of stating what a stance actually is, why it is held, and what would change it.

The full allocation matrix

One of four. The others are built the same way.

I
23 markets
II
Econometric Sector Models
you are here
III
ten ratios, every constituent
IV
Econometric Stock ModelsQuantitative ScreensFundamental Models
three tiers
Figures shown are current model output and change when the models are re-estimated. Prepared for information purposes only. Nothing here is investment advice, a solicitation, or an offer to buy or sell any security. Past performance is not a reliable indicator of future results.